Citation Statistics of Machine Learning Papers
The past several years have seen enormous growth of research papers in machine learning and deep learning. For a while now, I’ve been curious about the trends of this growth. For example, what papers have had an especially significant impact on the community? What are topics that researchers are excited about, and how has this changed over the past years?
As a first attempt to understand this, I wrote some code to scrape authors, (noisy) author affiliations and citations of recent papers at NeurIPS (2014 – 2018) and ICML (2017, 2018).
The code to scrape this information, and the data (from running the scraper on 31st March 2019) can be found in this github repository.
I hope that the community will be able to build on this scraper to analyze other publication venues and papers, as well as use the data to perform additional statistical analysis!
Scraping the Data
Collecting the data was a pretty involved process. The list of papers page has the paper title and authors, but no affiliations or citations. Additionally, it is quite tricky to get paper citation information directly by querying Google Scholar. Luckily, searching for author profiles is more tractable.
So to get the citation information, I tried to find an author profile for each paper, and then went through their publications to find a match with the conference paper, which could be used to give the citation information (and their current affiliation.)
However, not all authors have a Google Scholar profile, and additionally, sometimes the name of a paper changes between the conference publication and its Google Scholar entry. So we can’t find citation and author affiliation information for all the papers.
But we don’t do too badly. Below is a plot of the total number of papers, and the number of papers we found citation information for.
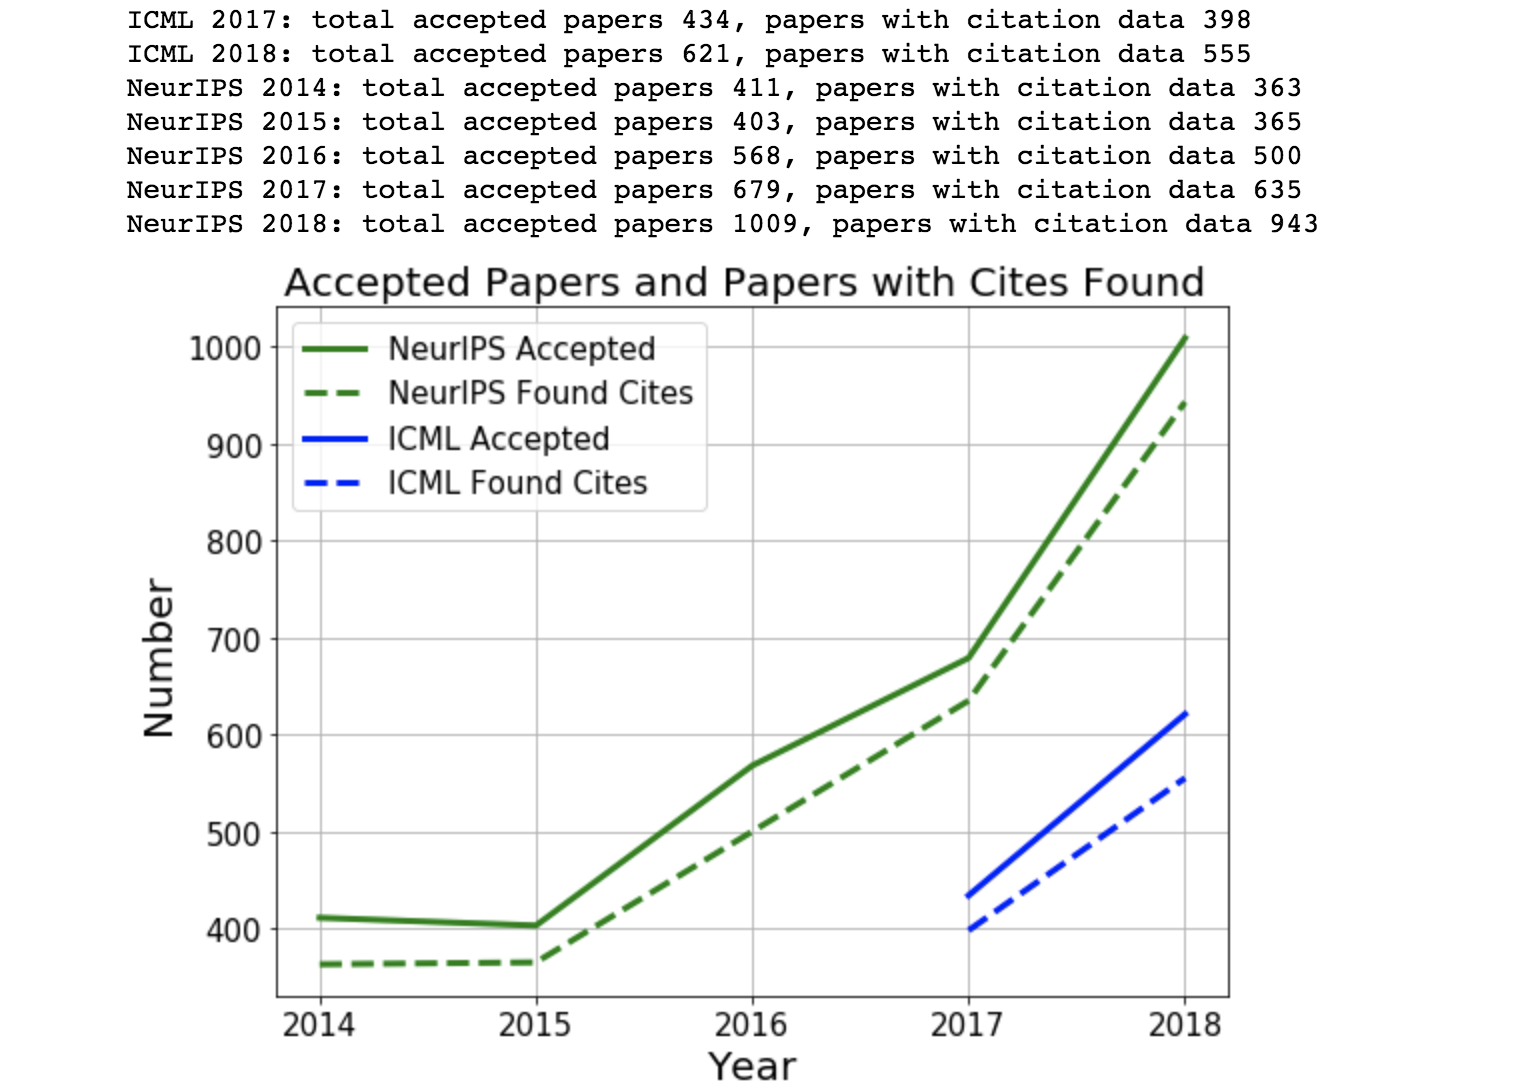
The total number of accepted papers (to NeurIPS (2014-2018) and ICML (2017, 2018)) are in solid lines and the number we found citation data for is shown with dotted lines. Not perfect, but it looks like there’s approximately a constant gap of 50ish papers.
Top Cited Papers, Citation Distributions and Topic Trends
Now that we have the data, we can start to analyze it! The simplest thing we can do is see what the top most cited papers are (of those we could find the data for). A quick disclaimer that paper citations are of course a highly imperfect measure of significance or impact, but they are a convenient measure for quantitative analysis.
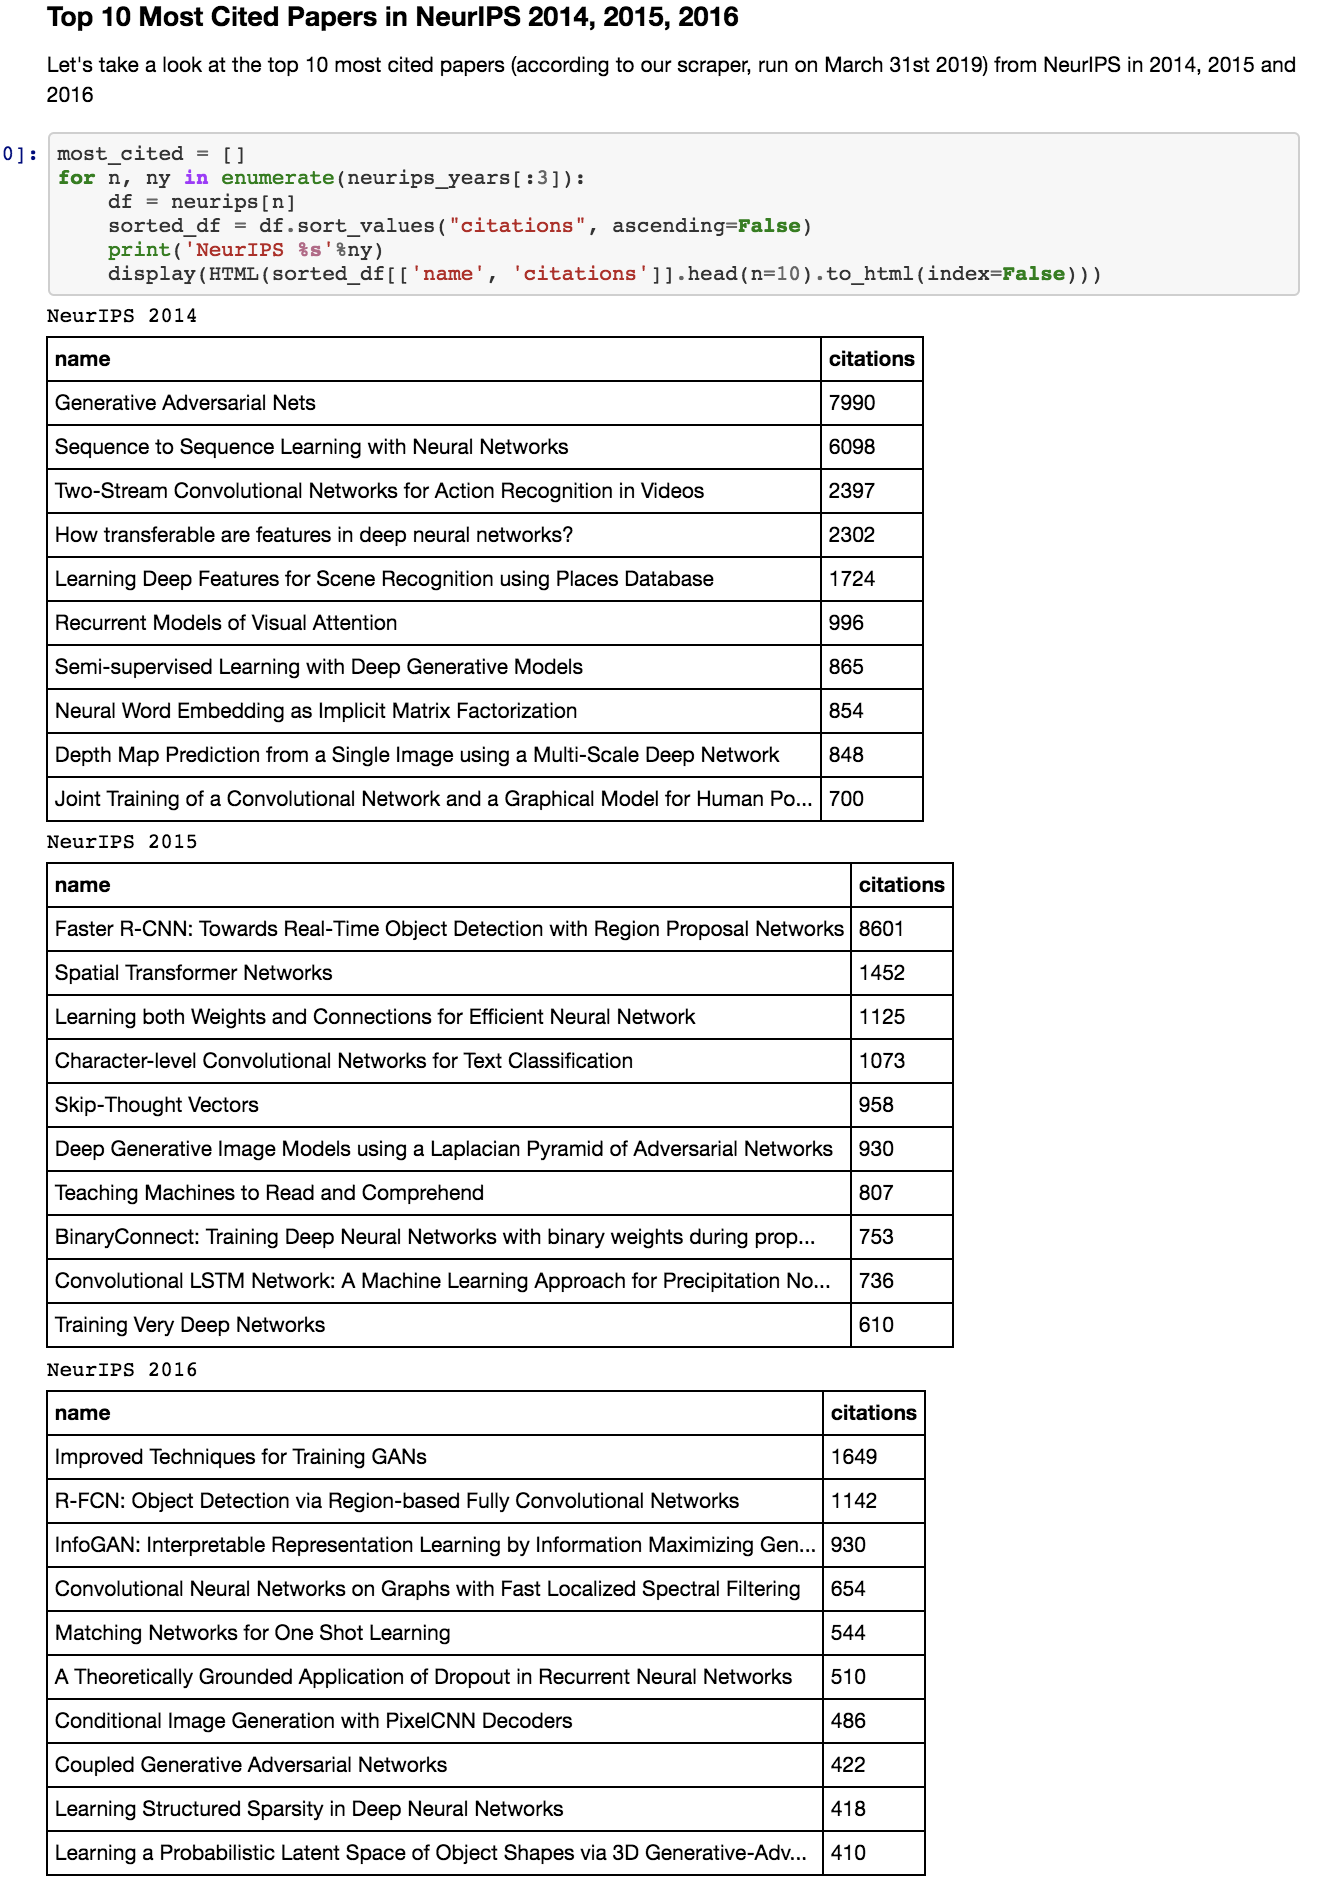
Above are the top 10 most cited papers in our dataset from NeurIPS in 2014, 2015 and 2016. This picture is really just a screenshot from the jupyter notebook overviewing how to analyze the data, and plotting some simple statistics.
Some highlights: in 2014, there is some very impactful work in generative models making an appearance, as well as papers on recurrent neural networks and attention. In 2015, the most cited paper by a margin seems to be on object detection. We also see work on compression and language embeddings make an appearance. 2016 shows several papers on generative models (particularly GANs) as well as work on few shot learning and CNNs for graphs.
Citation Distributions
We can also see how citations are distributed across all papers in a single conference.
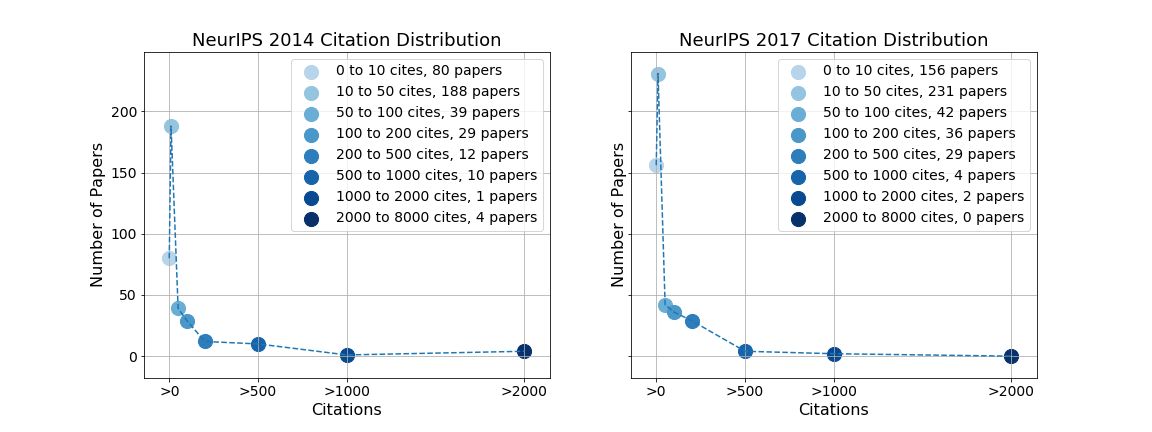
Specifically, we can bin papers according to the number of citations they have, and see how many papers fall into each bin. Above are what these plots looks like for papers at NeurIPS 2014 and NeurIPS 2017. Interestingly, in both the 2014 and 2017 plot, we see that the most common citation band is 10 - 50 citations. There are some simple followup questions that spring to mind, such as
- What are the topics that are most common in each bin?
- How do these citation distributions change through time?
For future work!
Topic Trends
We can also use the title information to study topic trends. In the NeurIPS data, one nice example of this is with GANs. The original GAN paper was published in NeurIPS 2014, and since then, it’s been a very active area of research. Let’s take a closer look at what this looks like.
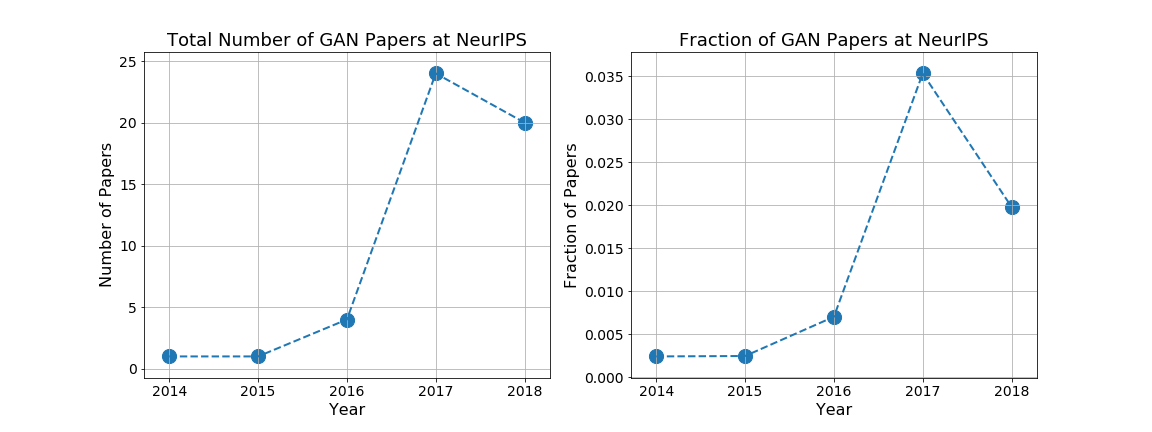
To generate the plots, I just searched the paper titles for the various possible GAN keywords, trying to be careful not to have any false matches. In 2014, there was only one GAN paper (the original one), but by 2017, there were almost 25 papers, corresponding to 3.5% of the entire set of published papers. We can also see that the proportion of GAN papers has decreased in 2018 (at least in NeurIPS.)
A (noisy) Academia/Industry Breakdown
So far, our analysis has only used paper title and citation information. But we also have an author affiliation for each paper. Recall that the affiliation for each paper is assigned by taking the affiliation listed for the author on Google Scholar. There are some shortcomings of collecting affiliations in this way:
- We only have one affiliation for each paper, corresponding to one author of the paper. (This is often the first author, but may also be a different author.)
- The significant challenge: the author affiliation is their current affiliation, not the affiliation they had when they wrote the paper.
Of these, the main issue is 2. There is a significant chance that authors may have changed affiliations since writing the paper, particularly for papers from the older conferences, such as NeurIPS 2014. I spent some time thinking about this, but aside from trying to scrape the data in the pdf (or maybe the paper source from the arXiv), there didn’t seem to be an easy way to get the author affiliation at the time the paper was published.
We’ll bear these sources of noise in mind (and investigate their effect later) and go ahead and try and compute an approximate academia/industry split from our noisy data.
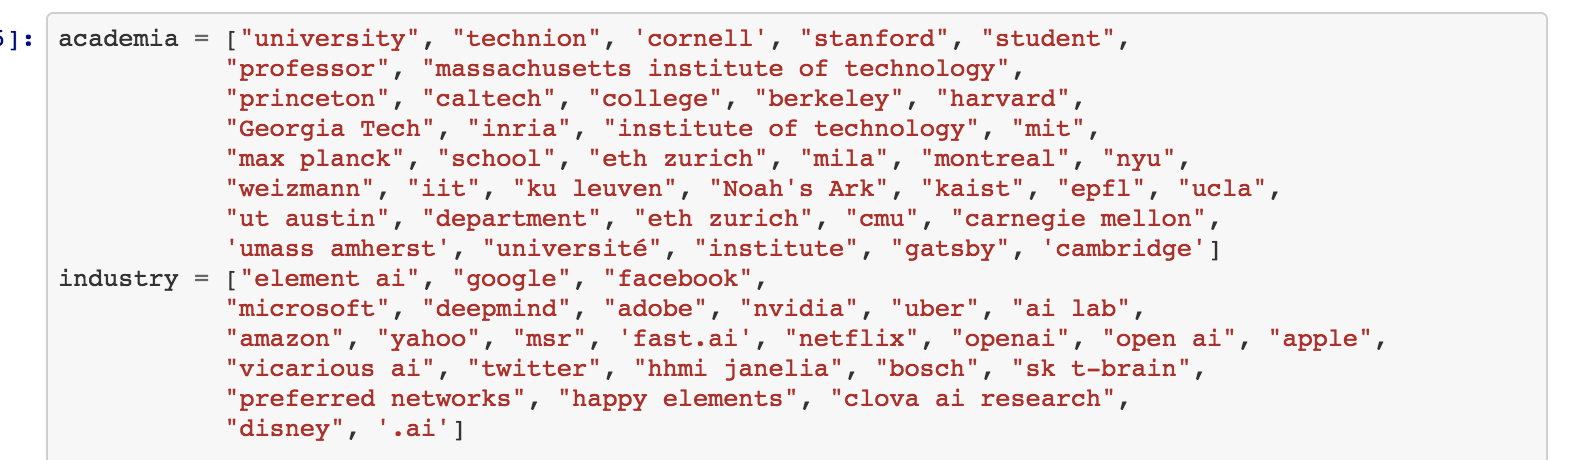
There are many, many different institutions publishing (e.g. this nice post, and it would be very tiring to enumerate and categorize them all. So I came up with a list of keywords for academic institutions and industry labs. These are not at all comprehensive, but I hope give a reasonable sample of both. Below is a screenshot of the keywords:
We can then plot what the academia/industry split looks like, across all papers and different citation bands. For example, what is the split like in the top 5% most cited papers?
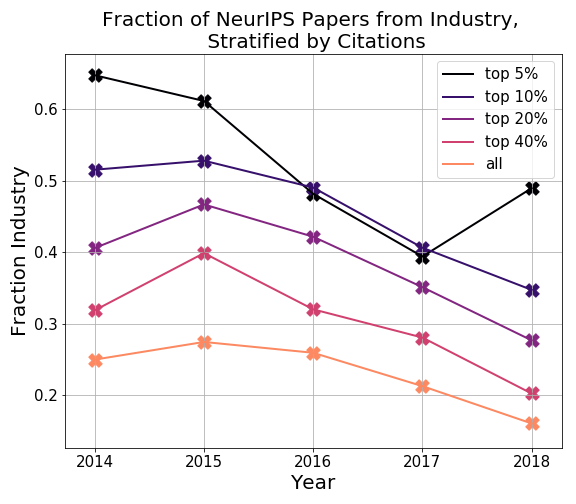
The results show some surprising trends. Firstly, the fraction of industry papers seems to be going down over time. Secondly, the number of top cited (e.g. top 5% cited, top 10% cited) papers from industry in earlier years is very high.
Both of these trends are likely to be affected by the fact that we only have the current affiliation of authors, so let’s take a closer look.
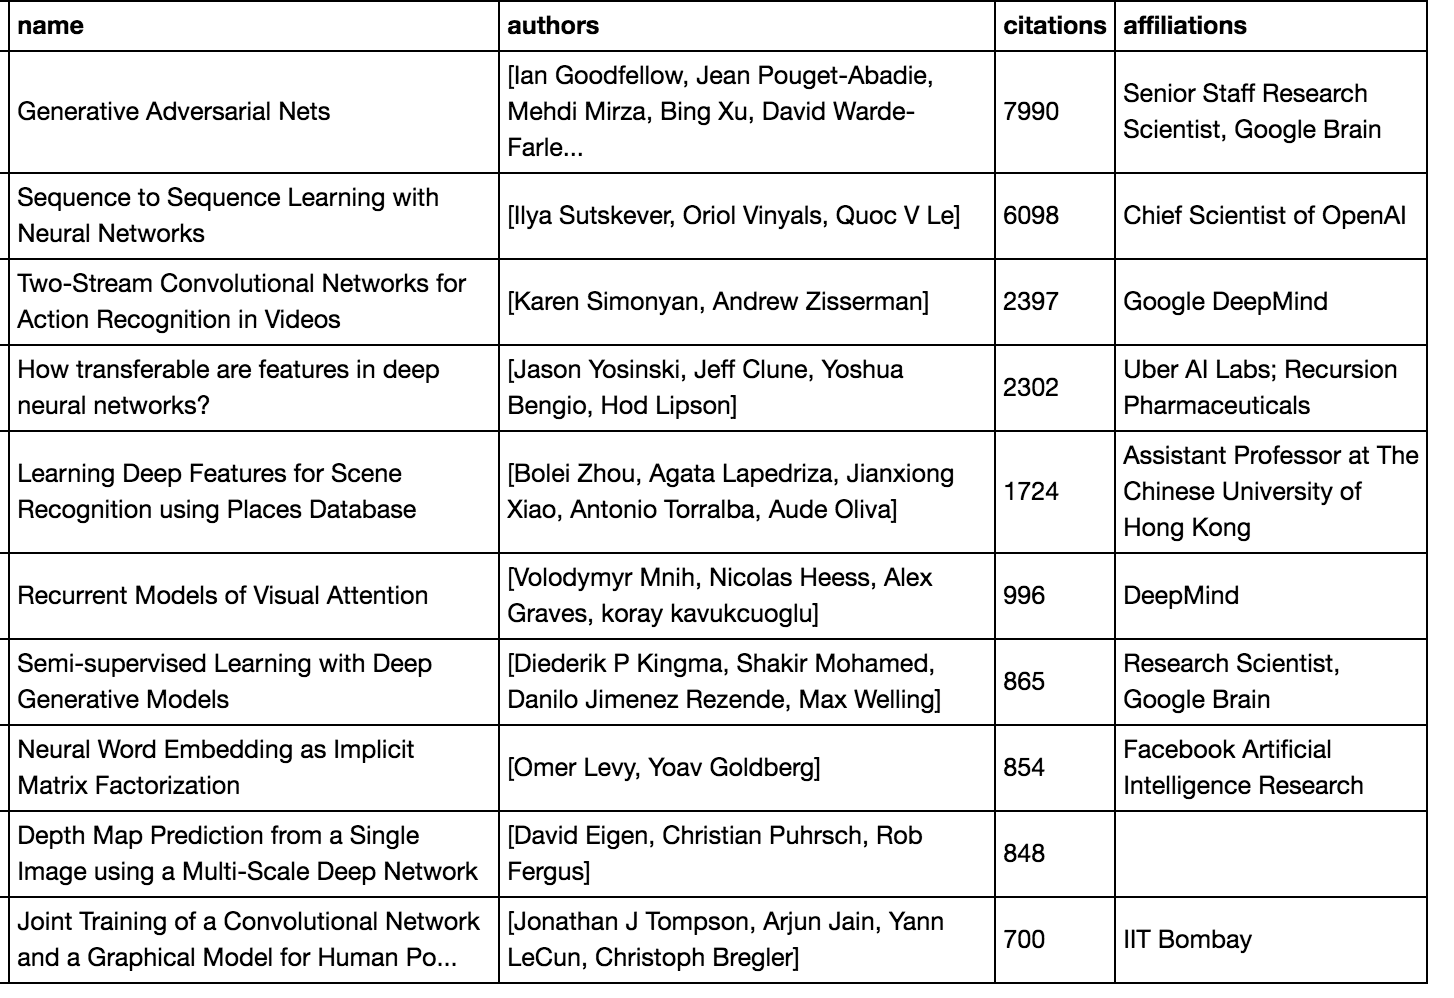
Above is a picture of the top 10 cited papers from NeurIPS 2014, this time with affiliations. We see that the current affiliations are predominantly industry. However, if we manually look up the 2014 papers to find affiliations, we see that:
- Generative Adversarial Nets has a MILA affiliation
- Two-Stream CNNs has a University of Oxford affiliation
- How transferable are features in DNNs has a Cornell/MILA affiliation
- Semi-supervised Learning with Deep Generative Models has a (primary) University of Amsterdam affiliation
- Neural Word Embeddings has a Bar-Ilan University affiliation
- Depth Map Prediction has a NYU affiliation
So in fact these papers were predominantly from academia, but most of the authors now have industry affiliations.
What about more recently?
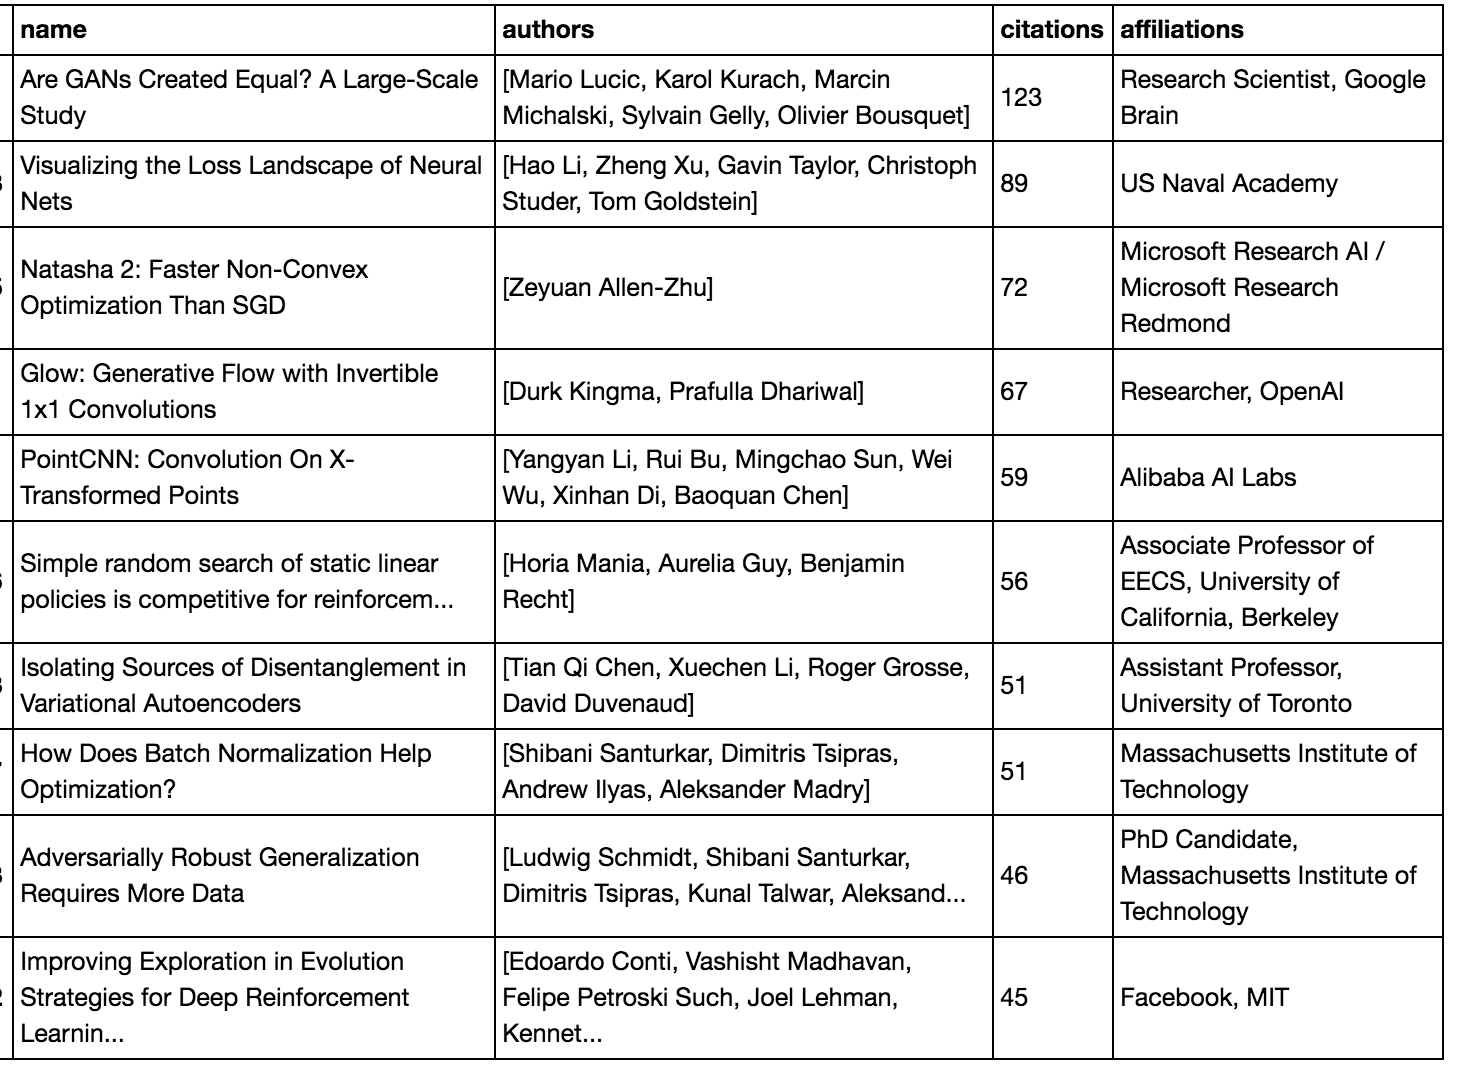
Above is the same result for the top cited papers from our data for NeurIPS 2018. A first skim through seemed to show that all of the affiliations were mostly accurate (at least regarding academia or industry) – so the approximate 50-50 split between academia and industry shown in the data is reflective of the true split.
Academia/Industry Breakdown Conclusions
So what can we conclude from the academia/industry breakdown?
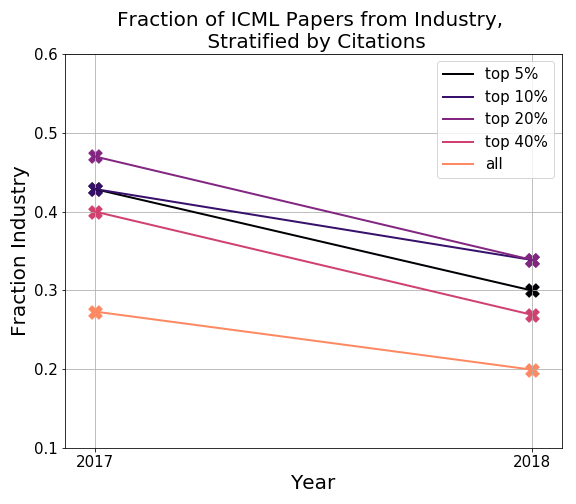
Due to only having current author affiliations, it seems safest to discard the data from 2014-2016, and maybe only take the trends we see in 2017 and 2018. As an additional sanity check of the data from 2017, 2018, the roughly 25% fraction of all papers being from industry in ICML 2017 (in the plot above) also agrees with the ballpark estimate given in Andrej’s post.
One conclusion that does still hold is that industry seems to have a significant number of highly cited papers. In both the ICML and NeurIPS results for 2017 and 2018, we see that the top 5%, 10% most cited papers from industry are noticeably higher (around 40%) than the total fraction of papers from industry (around 20%).
Open Questions
I hope the data and code are a useful resource for the community to build on and provide further insights! Some open questions/ideas that came up during the process that might be fun to investigate:
- Clustering of paper titles to get a better overview of all the different topics
- Are there certain topics that get more citations/fewer citations?
- How do reviews compare to the total number of citations a paper gets? (This would require some additional scraping of the NeurIPS/ICML website)
- Similar analysis on other conferences, such as CVPR/ICLR. This would only require editing the scraper to also get accepted papers from those websites instead of just NeurIPS/ICML, which should be relatively easy.
- Semantic scholar has a nice API with which it might be interesting to further explore some of these questions!
Acknowledgements
Thanks to Samy Bengio, Ben Poole, Arun Chaganty, Emma Pierson, Jeff Dean, Aniruddh Raghu, Chris Olah, Otavio Good, Diane Greene, Ilya Sutskever, Colin Raffel, David Ha, Bharath Ramsundar, Andrej Karpathy and Quoc Le for feedback on draft versions of the post!